Menu
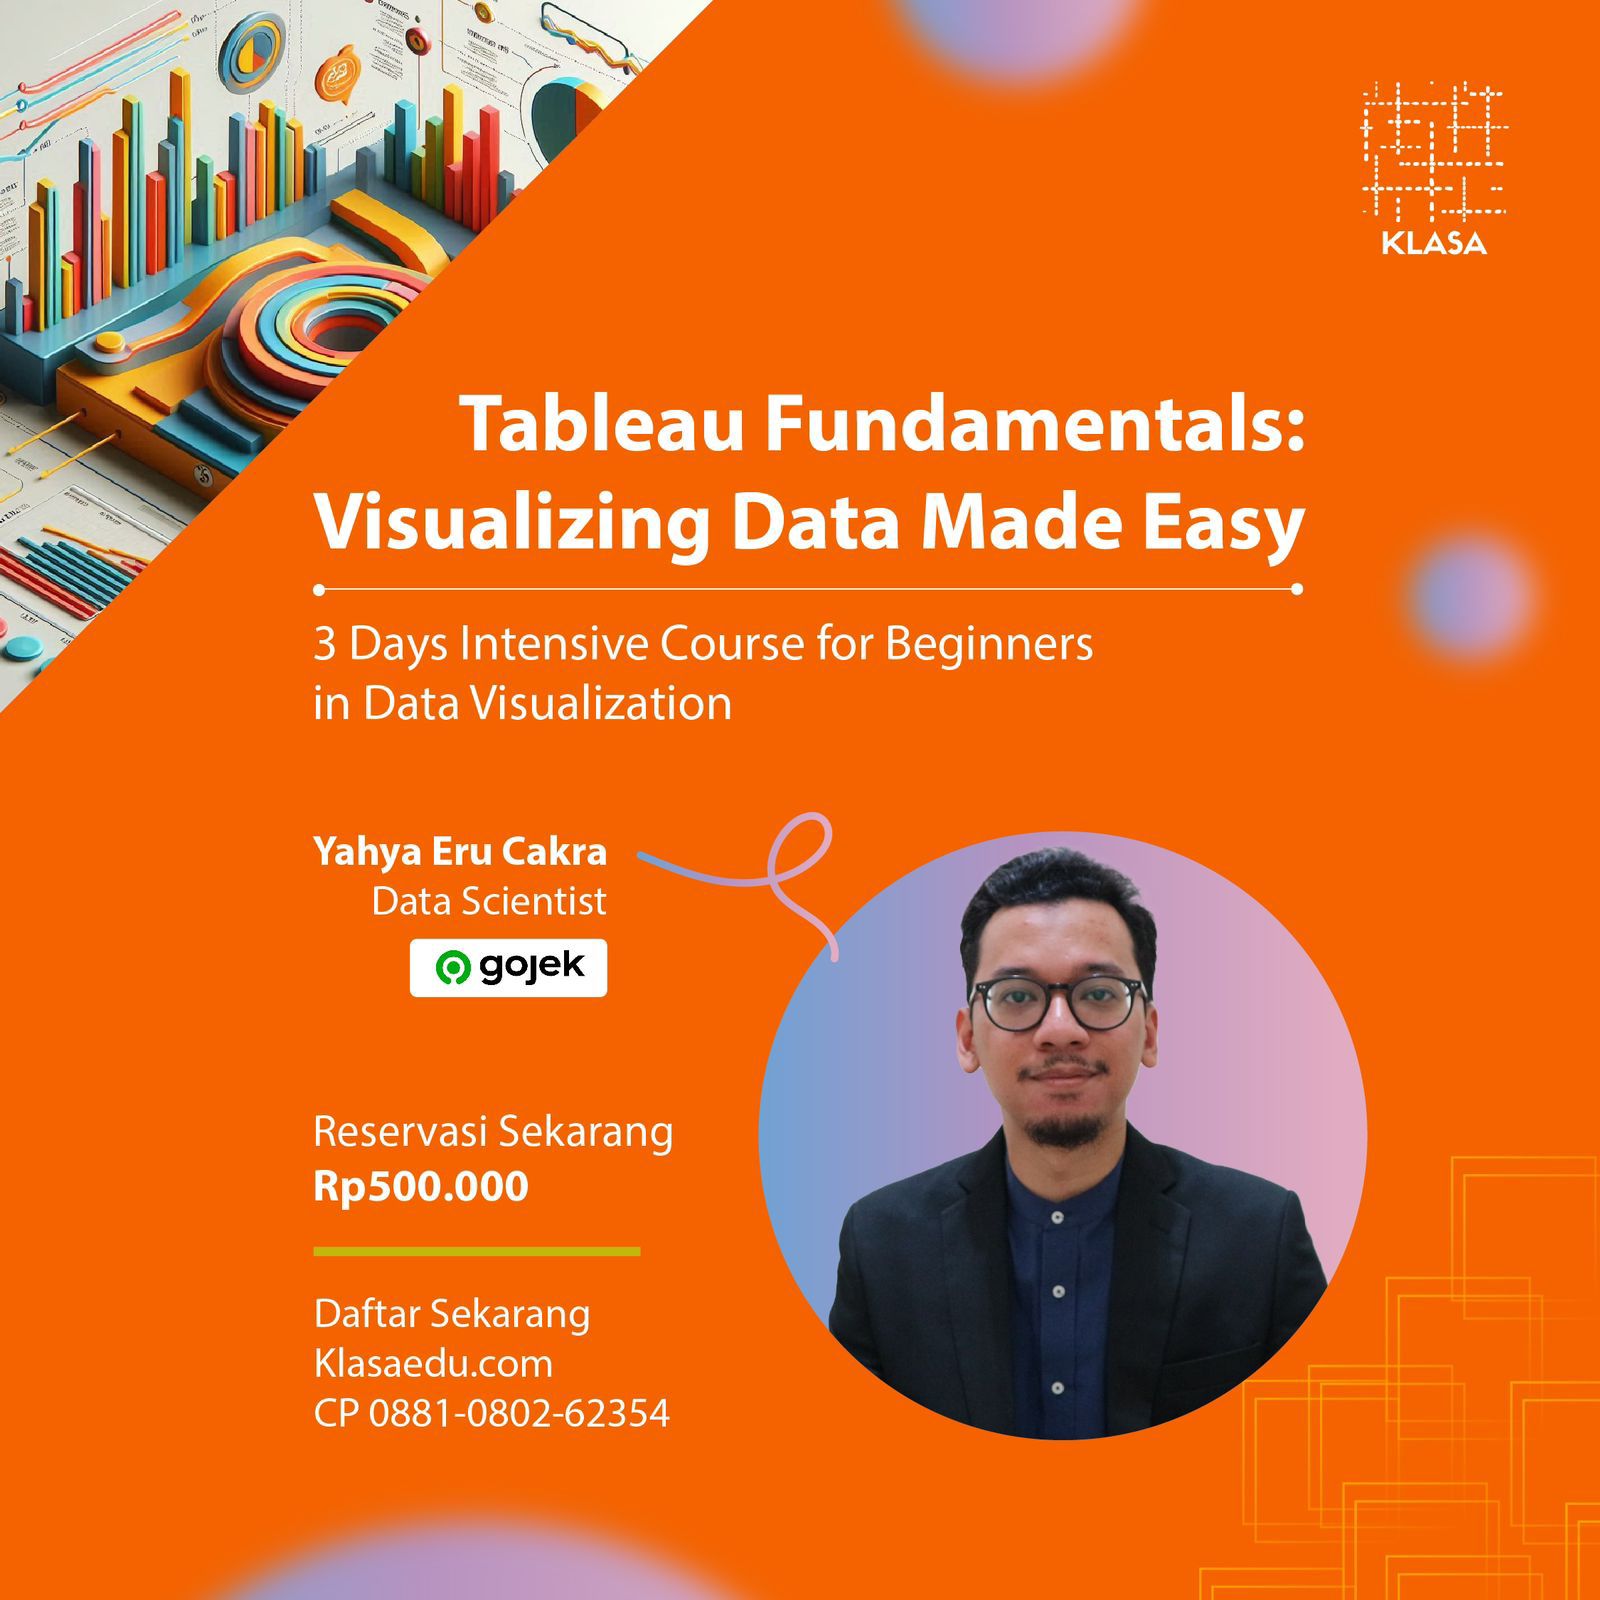
Mastering Tableau : Tableau Fundamentals : Visualizing Data Made Easy
3 Days Intensive Online Course
Capstone Project for Portfolio
- Hari kerja, 19.30 – 22.00
- Akhir Pekan, 10.00 – 12.00
This Program is made for you
A college students who interested in Data Career and need to create a Portfolio to get hired
You who want to accelerate your career by being expert in making good Data Visualization
You who want to learn about data visualization
Program overview
Session (s) > 1 Session (120 minutes)
- What is Data Visualization (DataViz)
- Why Data Visualization is important for business
- Do’s & Don’ts in Data Visualization
- Framework in Data Visualization
- Introduction to Tableau
- Introduction to Storyboard
- Creating basic visualizations using Tableau
Session (s) > 1 Session (120 minutes)
- Importing and cleaning data in Tableau
- Understanding data relationship in Tableau
- Working with joins, blends, and unions
- Extract Data & Live Connection in Tableau
- Creating calculated fields
- Filtering and sorting data
- Creating basic charts and graphs
Session (s) > 1 Session (120 minutes)
- Infographics vs. Interactive Dashboard
- Framework in creating Infographics Dashboard
- Minimalism in Dashboard
- Understanding principles of effective visualization
- Using color and typography effectively
- Building effective dashboards and presentations
- Best practices for data visualization in Tableau
- Implementing action features on Tableau: filter, highlight, URL, Go to Sheets, Set Action
- Launch your first business dashboard to public
The Dashboard from past participants
Previous slide
Next slide
Coach profile

Gandes Goldestan
Tableau Public Ambassador '22
Professional Business Intelligence Analyst dengan pengalaman bekerja di institusi publik. Gandes memiliki pengalaman bekerja di BUMN, OJK, dan saat ini adalah Business Intelligence Analyst di Jabar Digital Service. Gandes mendapatkan beberapa penghargaan diantaranya menjadi Tableau Public Ambassador ’22, Tableau Public Featured Author ’21, 5x #VOTD (Viz of the Day)

Rp500.000
30-Day Money-Back Guarantee
About this course:
Level
Students
113,290
Duration:
3 Days Transforming Career As Data Scientist Program komprehensif untuk mempelajari skill spesifik Tableau untuk data visualization.
Downloadable Files:
18 files
Benefits:
Download
e-certificate
Free Career Coaching
With Industrial Expert
Join KLASA
Professional Network

 by
by